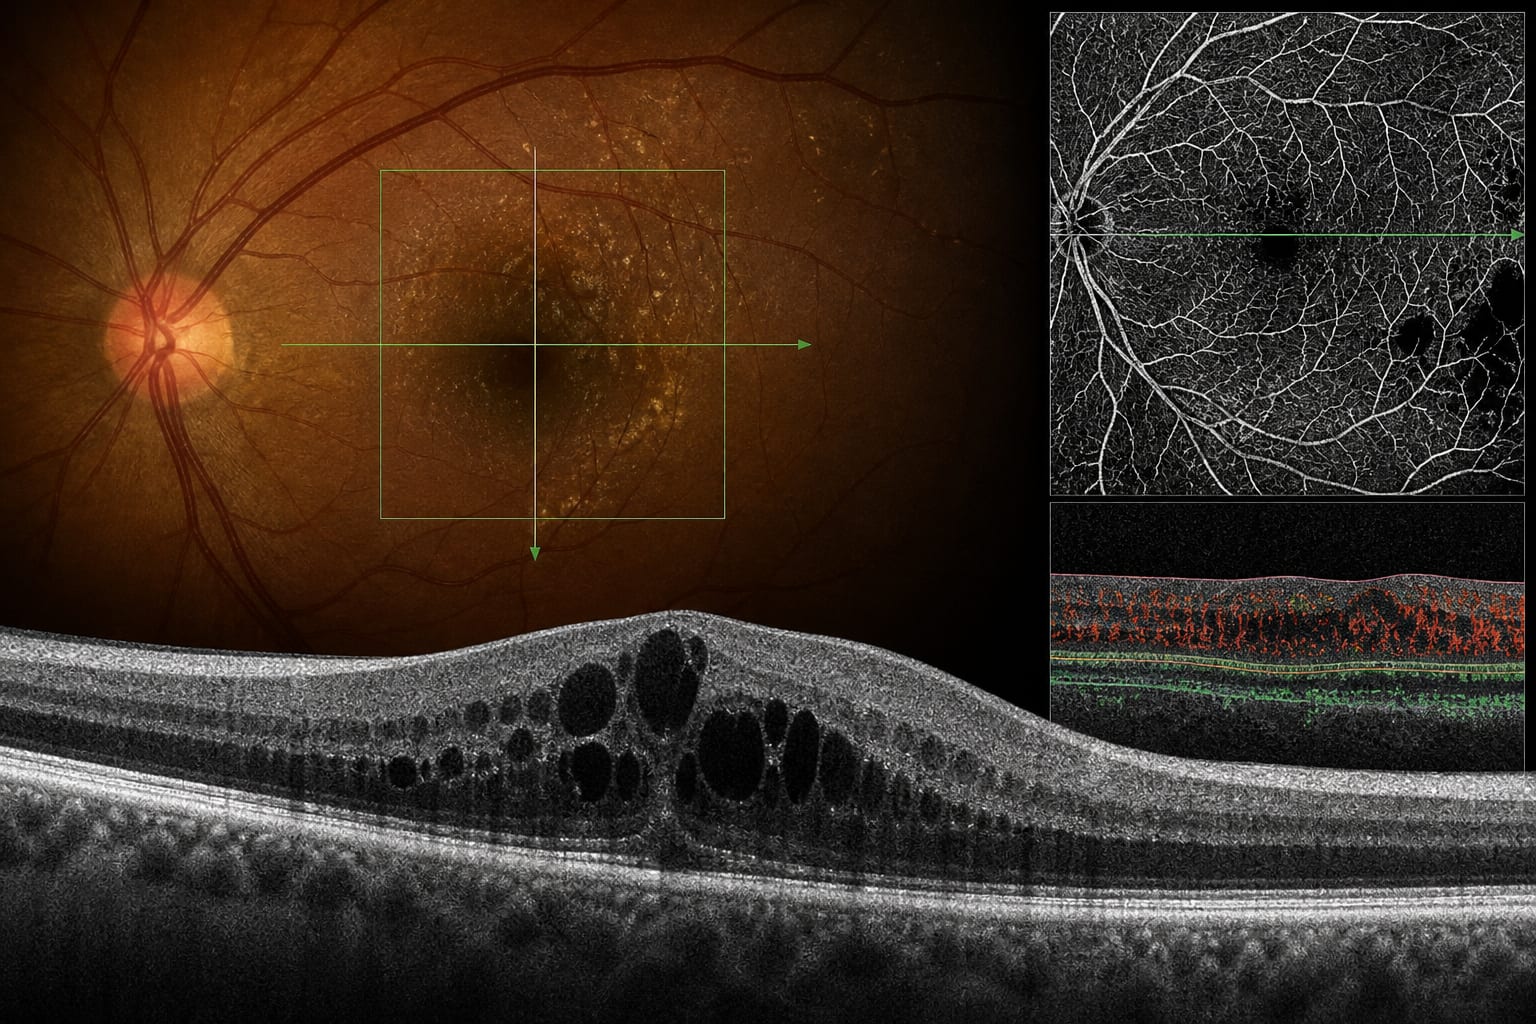
Imaging markers for diabetic macular oedema: Forecasting visual outcomes beyond retinal thickness
-
By
-
Enrico Borrelli
-
October 18, 2026
Clinical Scorecard: Imaging biomarkers associated with visual outcomes in diabetic macular oedema
At a Glance
| Category | Detail |
|---|---|
| Condition | Clinical topic addressed by the source article: Imaging markers for diabetic macular oedema |
| Key Mechanisms | Structural OCT features and OCTA measures of retinal capillary perfusion are associated with visual acuity and visual-acuity change during anti-VEGF treatment. The source also identifies diabetic macular ischaemia assessed by OCTA as a strong predictor of long-term visual outcomes. |
| Target Population | Patients or participants described in the source article. |
| Care Setting | Assessment of visual prognosis in DMO using retinal imaging. |
Key Highlights
- In the 60-eye post hoc analysis, mean visual acuity increased from 62.9 letters at baseline to 75.4 letters at week 52.
- Baseline central subfield thickness (CSFT) independently predicted baseline visual acuity and week-52 visual acuity.
- A composite of superficial perfusion density and vessel length density was independently associated with week-52 visual acuity.
- Greater baseline volume of hyperreflective foci was independently associated with a smaller visual-acuity gain.
- The source identifies diabetic macular ischaemia assessed with OCTA as one of the strongest predictors of long-term visual outcomes.
- A meta-analysis of 27 studies and 75 candidate biomarkers found five associated with reduced visual acuity at two or more time points, with moderate certainty.
Guideline-Based Recommendations
Diagnosis
Management
Monitoring & Follow-up
- The source notes that CSFT explains only a limited fraction of variation in visual acuity; it discusses visual outcomes alongside imaging features.
- The source describes standardised OCTA acquisition and processing—including scan protocol, slab definitions, segmentation, projection-artefact removal, and binarisation thresholds—as prerequisites for comparable measurements.
Risks
- The featured analysis was limited by 60 eyes, discretionary OCTA acquisition, use of Heidelberg Spectralis scans, models accounting for 19%–32% of variance, and no adjustment for multiple comparisons.
- OCTA vascular measurements may vary by device and analysis pipeline; thresholds may not transfer between centres unless acquisition and processing are reproduced.
- The exclusion of deep vascular complex metrics from the models may reflect more consistent measurement of the superficial slab in oedematous eyes, rather than greater biological relevance.
Patient & Prescribing Data
Patients with DMO treated with anti-VEGF injections; the featured analysis used baseline imaging and week-52 visual-acuity data from 60 eyes.
The article reports associations between baseline imaging biomarkers and visual outcomes, but does not provide prescribing instructions or validated biomarker-based treatment thresholds.
Clinical Best Practices
- The source describes limited concordance between CSFT and visual acuity and discusses structural and vascular imaging features in relation to visual outcomes.
- The source notes that post hoc biomarker findings require validation and that evidential strength depends on the number of eyes included.
- The source identifies standardised imaging acquisition and analysis as prerequisites for comparable OCTA measurements.
- The source discusses prespecified imaging substudies as a way to develop exploratory signals into more reliable estimates.
Related Resources & Content
Based on findings from:
Imaging biomarkers in diabetic macular oedema: Predicting vision beyond retinal thickness
Enrico Borrelli. Eye, 2026.
https://www.nature.com/articles/s41433-026-04986-0
This content is an AI-generated, fully rewritten summary based on a published scholarly article. It does not reproduce the original text and is not a substitute for the original publication. Readers are encouraged to consult the source for full context, data, and methodology.