Beyond the dose-volume histogram: a critical appraisal of normal tissue complication probability modelling for osteoradionecrosis of the jaw and a strategic framework for clinical translation - Scorecard - MDSpire
Conexiant’s news site is now MDSpire News. Learn more
Advertisement
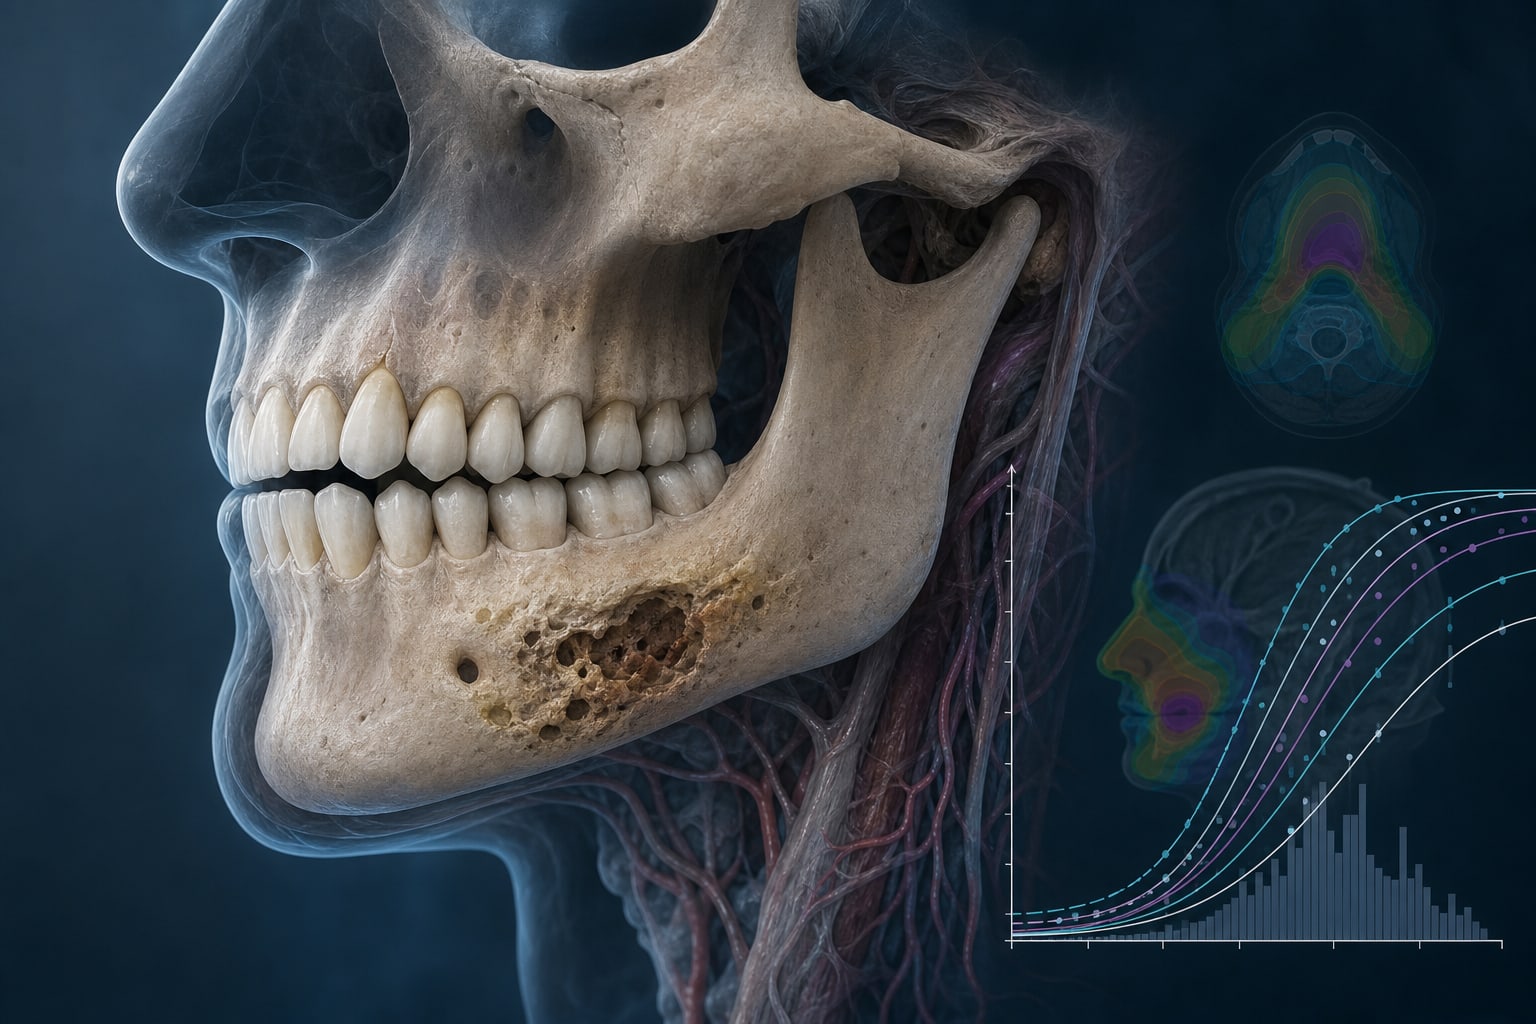
Evaluating Normal Tissue Complication Probability Models for Osteoradionecrosis of the Jaw: A Comprehensive Review and Framework for Clinical Application Beyond Dose-Volume Histograms
Clinical Scorecard: Evaluating Normal Tissue Complication Probability Models for Osteoradionecrosis of the Jaw: A Comprehensive Review and Framework for Clinical Application Beyond Dose-Volume Histograms
At a Glance
Category
Detail
Condition
Osteoradionecrosis of the Jaw
Key Mechanisms
Radiation-induced hypoxia, hypovascularity, and hypocellularity of bone and soft tissue.
Target Population
Patients with head and neck cancer undergoing radiotherapy.
Care Setting
Clinical oncology and radiotherapy departments.
Key Highlights
Incidence of osteoradionecrosis is 7-10% in head and neck cancer patients.
Key predictors for ORN include D30% and pre-RT dental extraction.
The Weibull Accelerated Failure Time model introduces a time-to-event framework for ORN risk assessment.
Deep learning methods have shown promise but require further validation for broader adoption.
Guideline-Based Recommendations
Diagnosis
Utilize NTCP models to estimate individual risk of osteoradionecrosis.
Management
Consider pre-RT dental extraction as a significant factor in treatment planning.
Monitoring & Follow-up
Implement longitudinal risk assessment using validated models.
Risks
Monitor for signs of ORN in patients with high-risk factors such as high mandibular doses.
Patient & Prescribing Data
Head and neck cancer patients receiving radiotherapy.
Incorporate dental health status and radiation dose metrics in treatment planning.
Clinical Best Practices
Employ multi-institutional data to enhance model calibration and validation.
Utilize graphical user interfaces for visualizing patient-specific risk trajectories.
Baptist Health will bring together leading physicians, researchers and healthcare professionals from South Florida and across the country for the 14th Annual Baptist Health Miami Neuroscience Symposium, taking place Nov. 4-6, 2026, at Hilton Miami Dadeland and virtually via Zoom.