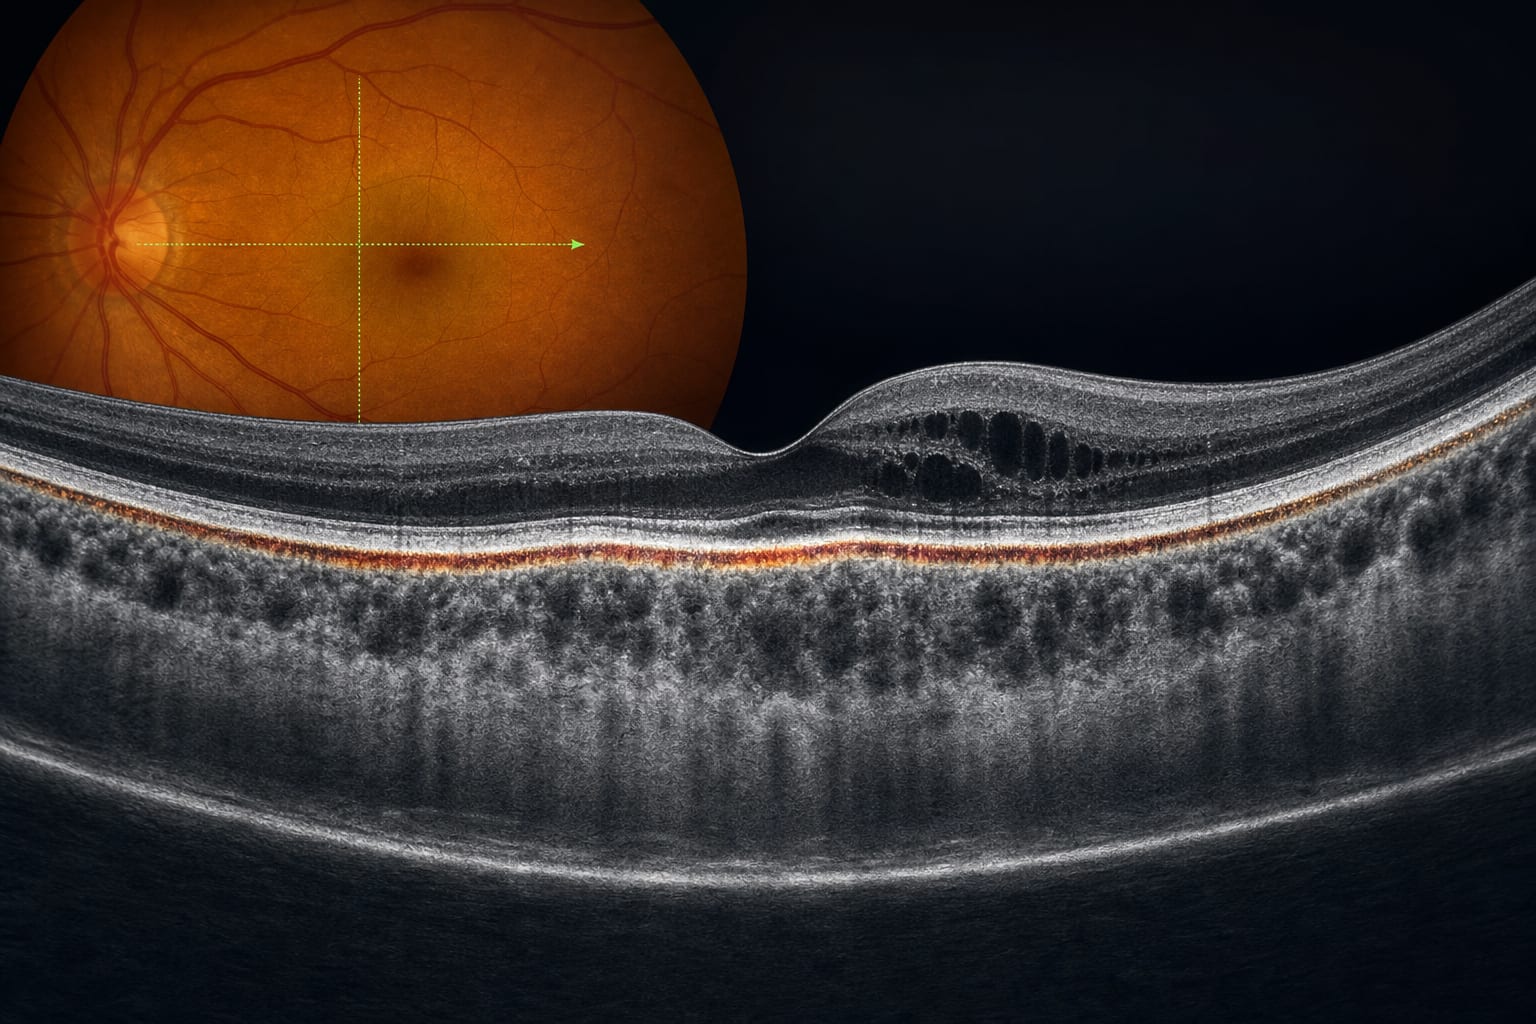
To analyze the optical coherence tomography (OCT) characteristics in different stages of posterior scleritis (PS) and explore possible correlations between OCT features and the different stages of PS.
Approach:
Study Design: Retrospective study on clinically diagnosed cases of PS with transparent media and good OCT images at an academic tertiary eye care center in India from April 2014 to March 2019.
Data Collection: Analysis of 25 predefined OCT biomarkers across acute, resolving, and resolved stages of PS.
Key Findings:
104 OCT plates from 31 patients were analyzed; 43 in acute, 28 in resolving, and 33 in resolved stages.
Acute PS showed 100% choroidal thickening, 97.7% RPE–choroidal bump, 90.7% ILM folds, and 86.0% NSD.
Resolving PS had 92.9% HRD in inner and subretinal space, and 89.3% in outer retina.
Resolved PS was characterized by 54.5% EZ reflectivity and 39.4% ERM.
Median central foveal thickness significantly declined from 737 µm in acute to 212 µm in resolved PS.
Acute PS was strongly associated with RPE–choroidal bump (odds ratio 527.7, 95% CI 54.8–5,079.4), ILM folds (OR 73.1, 95% CI 19.5–273.9), RPE thickening (OR 29.0, 95% CI 9.1–92.3), NSD (OR 14.8, 95% CI 5.0–44.0), cystoid macular edema (OR 8.3, 95% CI 3.4–20.5), and vitreous cells (OR 3.1, 95% CI 1.2–7.6).
Resolving PS showed associations with HRD involving the inner retina (OR 8.39, 95% CI 1.95–36.2), outer retina (OR 7.10, 95% CI 1.94–25.9), subretinal space (OR 7.43, 95% CI 1.72–32.2), and choroid (OR 4.50, 95% CI 1.20–16.8).
Resolved PS was associated with variable reflectivity of the EZ (OR 15.6, 95% CI 3.75–65.0) and ELM (OR 7.31, 95% CI 1.87–28.5), and posterior vitreous detachment (OR 2.80, 95% CI 1.29–6.11).
Interpretation:
OCT characteristics can aid in identifying the stage of disease activity in PS.
Limitations:
Retrospective design may introduce bias.
Exclusion of cases with poor image quality or other retinal pathologies.
Conclusion:
OCT characteristics analyzed in this study can aid in identifying the stage of disease activity in PS.
US claims data showed rising prevalence of diabetic retinal disease in type 1 and type 2 diabetes, while incidence declined in type 1 diabetes and moved closer to type 2 rates by 2022.
This week's research makes one thing clear: who someone is before they get sick — their relationships, their partner's health, the back of their eye — is doing a lot of work medicine is only beginning to account for.