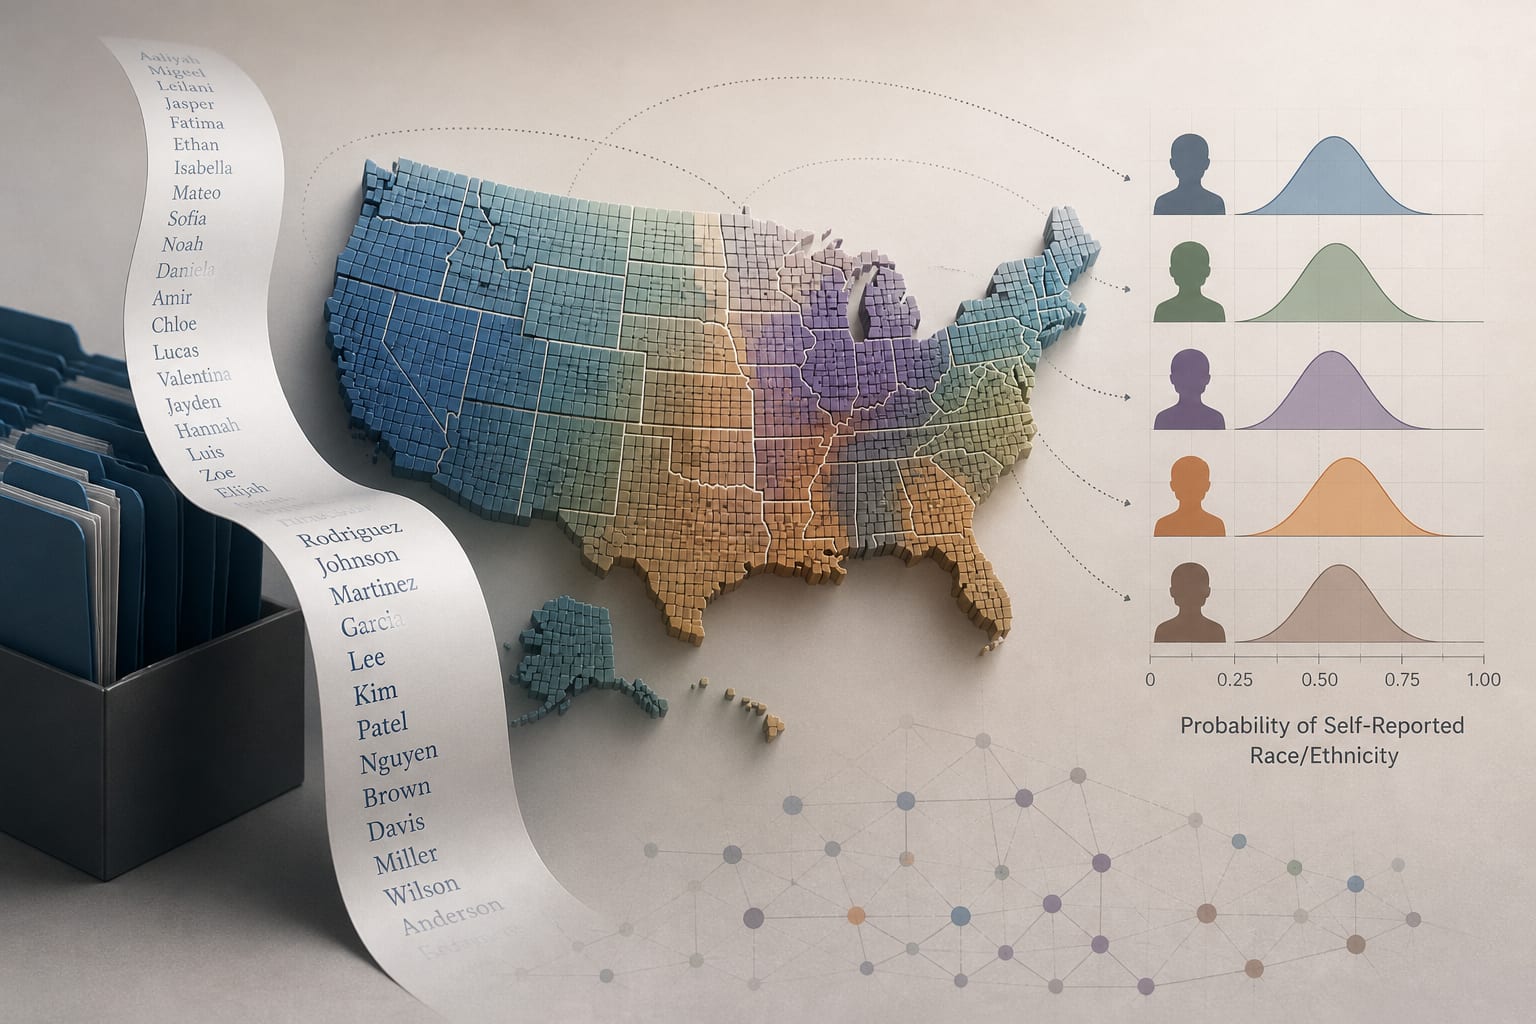
To compare the concordance of updated mBIFSG 2.0 and earlier mBIFSG 1.0 estimates with self-reported race and ethnicity.
Approach:
Study population: Cross-sectional analysis of 771,215 BCBSMA commercial or Medicare members surveyed in 2025 who self-reported as Asian American and Pacific Islander, Black, Hispanic, or White.
Comparison: mBIFSG 2.0 used 2020 Census first-name and surname data; mBIFSG 1.0 used earlier first-name and 2010 Census surname data. Both versions used the same 2020 Census block-group data.
Evaluation: Concordance with self-reported race and ethnicity was assessed overall and by sex using C-statistics.
Key Findings:
mBIFSG 2.0 concordance increased for all four groups: Black, 0.930 to 0.948; Hispanic, 0.916 to 0.930; Asian American and Pacific Islander, 0.967 to 0.976; and White, 0.912 to 0.921.
Improvements were generally greater among female than male members, ranging from 1.1 to 1.8 points for female members and 0.6 to 1.6 points for male members.
C-statistics remained somewhat higher for male than female members among Asian American and Pacific Islander, Hispanic, and White groups.
Interpretation:
The authors report that incorporating 2020 Census first-name and surname data improved concordance with self-reported race and ethnicity. They note that mBIFSG probabilities are intended for population-level assessment, not individual classification, and that downstream analyses should account for imputation uncertainty.
Limitations:
The study included respondents insured by one insurer, whose membership was predominantly, but not exclusively, located in Massachusetts.
Performance may differ among insurers and populations with different racial, ethnic, or geographic characteristics.
Conclusion:
Updated Census name data improved mBIFSG concordance for the four assessed groups in this insured survey population.