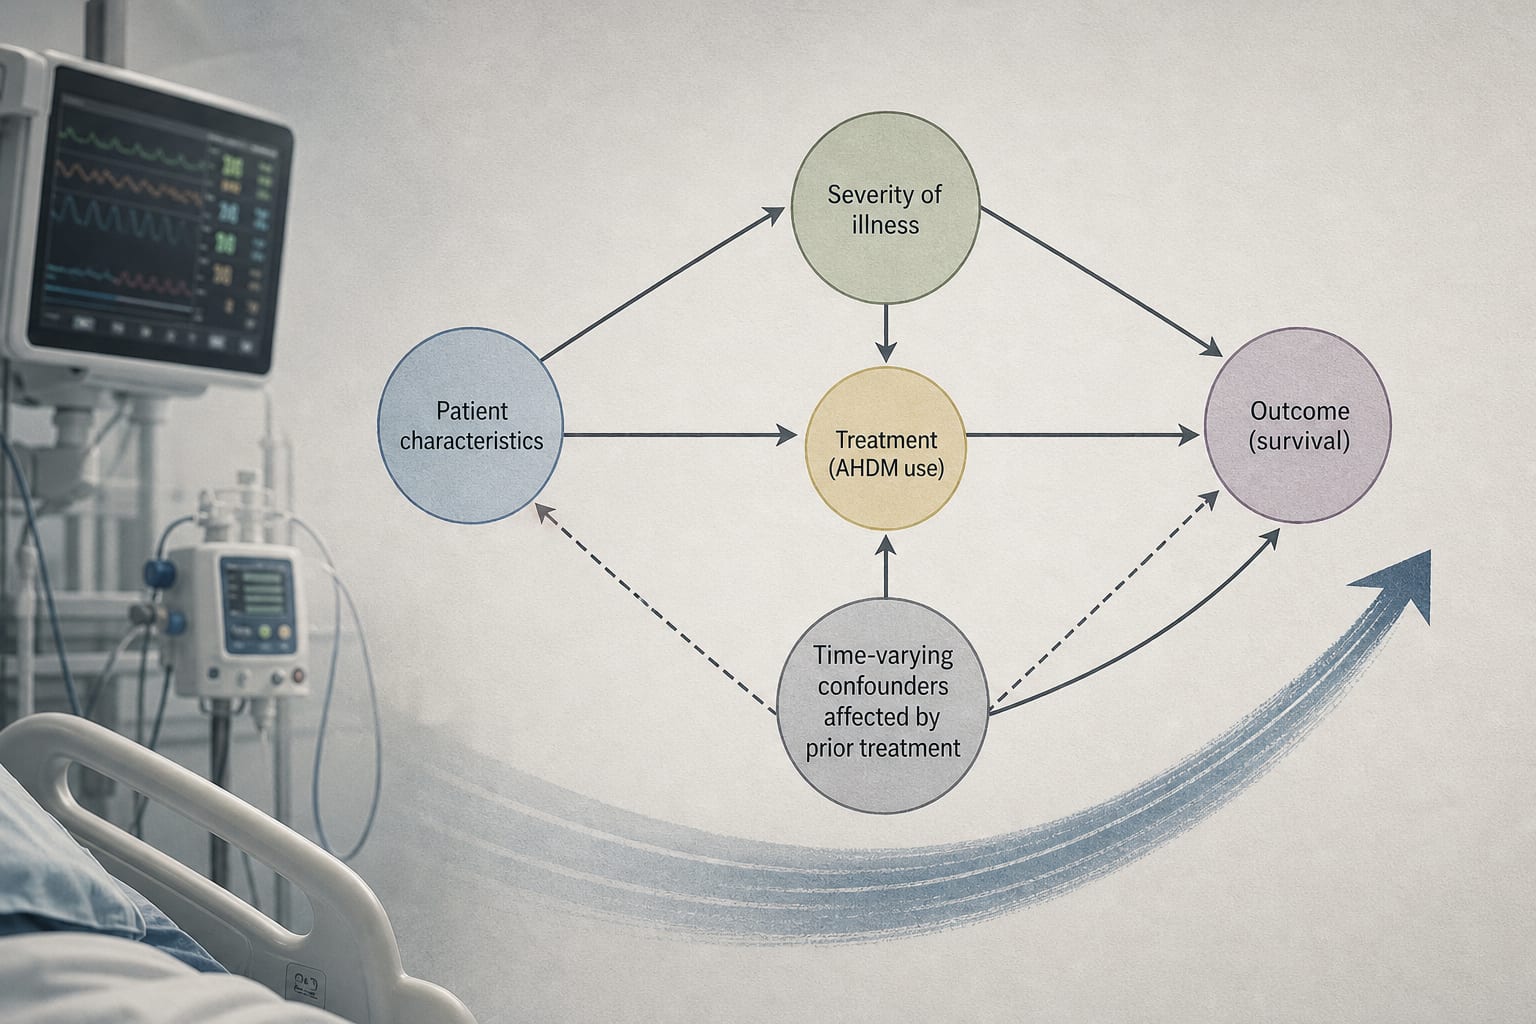
The article explains how causal diagrams clarify exposures, estimands, and adjustment choices in evidence synthesis, and how g-methods can address time-varying confounding when evaluating monitoring strategies.
Approach:
Causal diagrams: Directed acyclic graphs make assumptions about causal relationships explicit and help identify variables to adjust for or leave unadjusted when estimating a specified effect.
Define the exposure and estimand: Monitoring assignment, actual receipt of monitoring, and assignment to a monitoring-guided strategy are distinct exposures and causal questions.
Key Findings:
Nagy et al. pooled 20 estimates from 19 randomised and observational studies, reporting an odds ratio of 0.66 and a prediction interval of 0.18 to 2.40.
The pooled estimate combines potentially different interventions and estimands, so it cannot establish whether variation reflects settings, interventions, or study designs.
In PAC-Man, catheter-derived information changed management within two hours in 80% of patients, but the trial found no survival benefit; the study population was a general intensive care population, not patients specifically in shock.
Marginal structural models use inverse-probability weights for treatment and censoring based on covariate history; their validity depends on assumptions including correct model specification and no unmeasured confounding.
Interpretation:
The article argues that diagrams should be specified before evidence synthesis to clarify the exposure, estimand, confounders, mediators, and censoring process. Diagrams state assumptions rather than verify them, and g-methods do not remove the need for adequate data or their identifying assumptions.
Limitations:
Causal diagrams depend on substantive assumptions and cannot confirm that those assumptions are correct.
G-methods require no unmeasured confounding at each time point, positivity, consistency, and correctly specified treatment and censoring models.
Longitudinal g-methods require individual-level histories of treatment, covariates, and censoring; published summary estimates cannot recreate these data.
Conclusion:
Causal diagrams make the assumptions and causal questions underlying evidence synthesis explicit, while g-methods may address time-varying confounding when their identifying assumptions and data requirements are met.
Investigators found that symptom improvement remained possible years after infection, but patients with multisystem symptoms had lower likelihood of improvement.